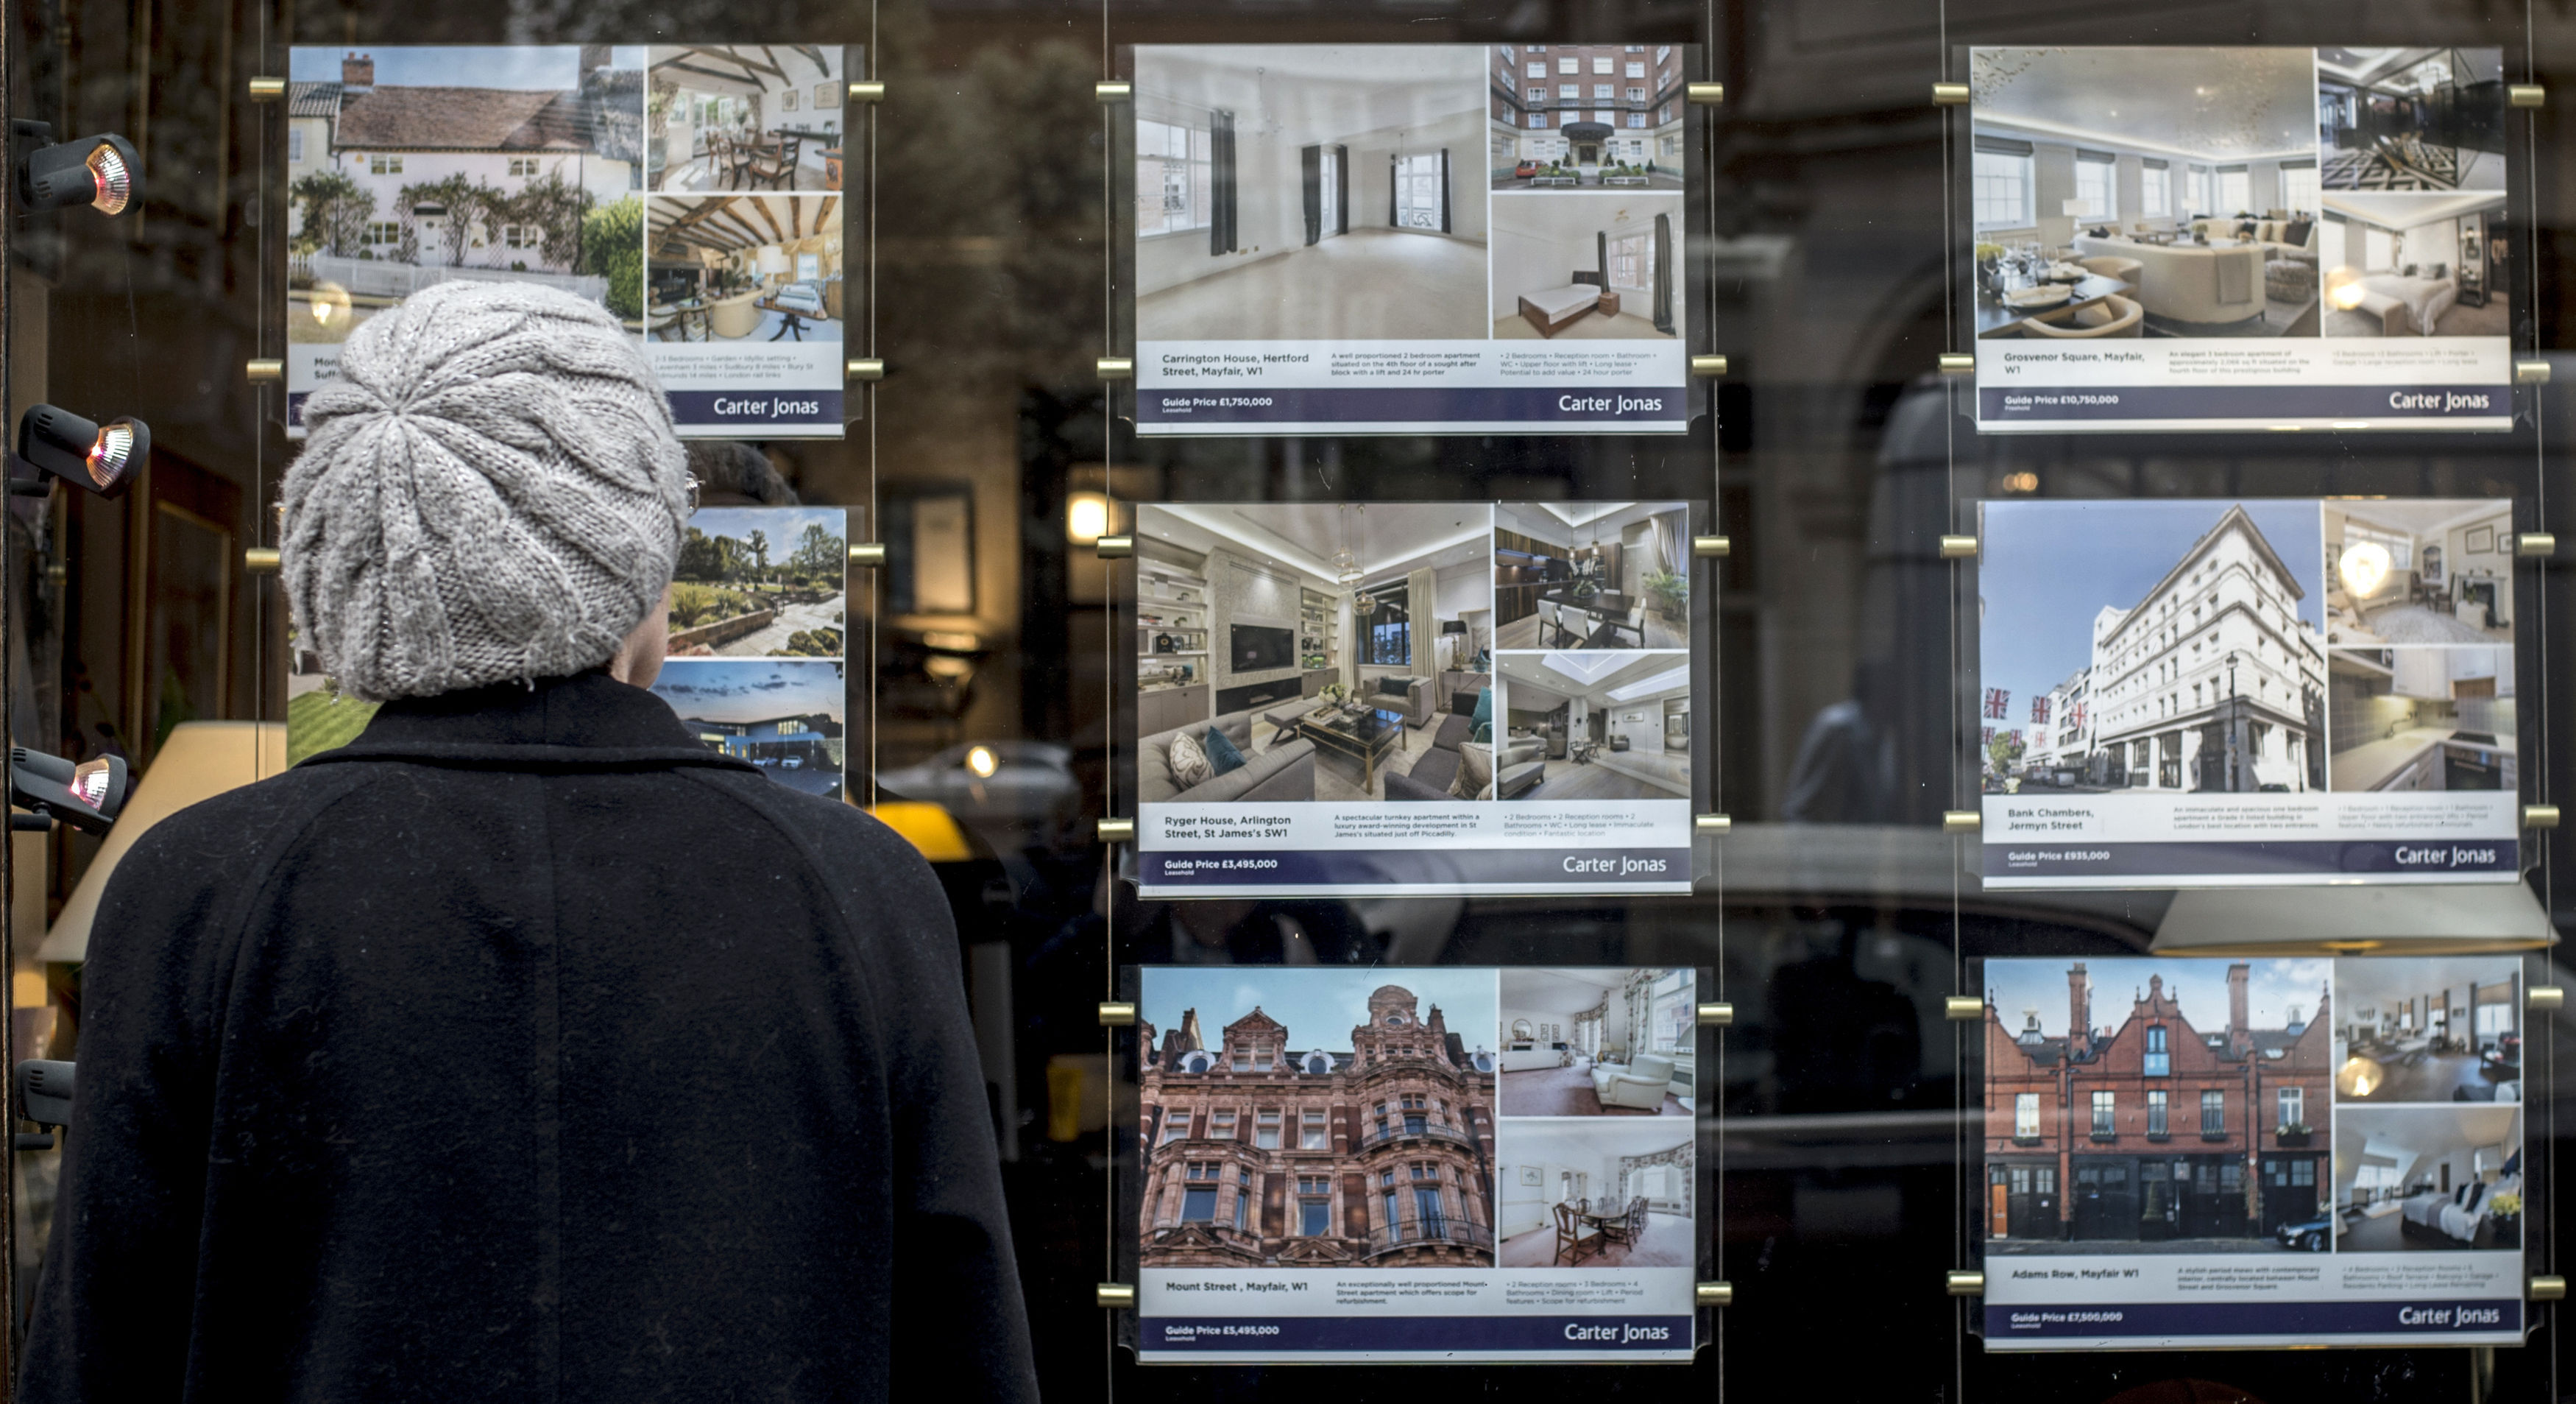
The proportion of homes which are “earning” more than their owners is shrinking as house price growth continues to slow, analysis has found.
The average rise in house prices over the last two years has outstripped post-tax earnings in less than one in 10 (8%) local authority districts, Halifax said.
This proportion is dwindling compared with nearly one in five (18%) in 2017 and nearly a third (31%) in 2016.
Across the UK, the average house price has increased by £14,975 over the past two years, while the average take-home pay over two years has been £46,225 – £31,250 more than house price growth.
Earnings exceeded house price growth consistently at a national and regional level across the UK – from £19,649 in London up to £35,250 in Scotland.
Leafy London borough Richmond-upon-Thames was identified as the local authority area where house price growth outpaces take-home pay the most.
The average house price there has increased by £55,483 more than typical net earnings over the past two years – equating to £2,312 per month – Halifax said.
The next biggest gap was found in Winchester, home to much of the South Downs National Park, in the South East of England – where average house price growth has outpaced average net wages over the past two years by £45,016 according to the research which used the Halifax house price database and Office for National Statistics (ONS) earnings figures.
Russell Galley, managing director, Halifax, said: “The majority of areas where house price inflation outpaced owners’ take-home pay are still to be found in London and the South East.”
Here are the top 10 areas where house price growth has outpaced wages over the past two years, according to Halifax, with the two-year increase in house prices followed by net average earnings over the two years and the difference:
1. Richmond-upon-Thames, London, £119,075, £63,592, £55,483
2. Winchester, South East, £103,196, £58,180, £45,016
3. South Buckinghamshire, South East, £97,806, £56,430, £41,376
4. West Devon, South West, £75,659, £40,198, £35,460
5. Windsor and Maidenhead, South East, £88,437, £60,153, £28,284
6. Wandsworth, London, £90,482, £62,247, £28,234
7. Bromsgrove, West Midlands, £77,621, £52,317, £25,303
8. Chichester, South East, £73,769, £48,778, £24,991
9. North Dorset, South West, £58,289, £43,158, £15,131
10. Harborough, East Midlands, £69,604, £55,167, £14,437
And here are the best-performing regions for house price growth outpacing earnings regionally over the past two years, with the the two-year increase in house prices followed by net average earnings over the two years and the difference (in some places there were no areas where house price growth outstripped wages, so the best-performing area has a minus figure. Halifax’s analysis on this did not provide a breakdown for Northern Ireland):
– North East, Newcastle-upon-Tyne, £45,562, £43,073, £2,490
– North West, Rossendale, £48,344, £39,350, £8,994
– Yorkshire and the Humber, Sheffield, £22,032, £43,765, minus £21,732
– East Midlands, Harborough, £69,604, £55,167, £14,437
– West Midlands, Bromsgrove, £77,621, £52,317, £25,303
– East of England, East Hertfordshire, £64,766, £55,349, £9,417
– London, Richmond-upon-Thames, £119,075, £63,592, £55,483
– South East, Winchester, £103,196, £58,180, £45,016
– South West, West Devon, £75,659, £40,198, £35,460
– Wales, Denbighshire, £46,974, £40,710, £6,264
– Scotland, West Lothian, £31,303, £45,279 minus £13,977
Here is the average increase in house prices over the past two years, followed by average take-home wages over the past two years, and the difference, according to Halifax. No nations or regions saw house prices increase over the past two years by more than the past two years of average earnings:
– North East, £10,581, £42,280, minus £31,699
– North West, £11,270, £43,384 minus £32,114
– Yorkshire and the Humber, £10,430, £42,688 minus £32,258
– East Midlands, £18,392, £43,371 minus £24,979
– West Midlands, £18,672, £43,615, minus £24,943
– East of England, £22,574, £48,220, minus £25,646
– London, £34,829, £54,478, minus £19,649
– South East, £20,483, £50,007, minus £29,525
– South West, £18,356, £44,609, minus £26,253
– Wales, £15,005, £42,848, minus £27,843
– Scotland, £10,490, £45,740, minus £35,250
– Northern Ireland, £16,480, £42,607, minus £26,127

Enjoy the convenience of having The Sunday Post delivered as a digital ePaper straight to your smartphone, tablet or computer.
Subscribe for only £5.49 a month and enjoy all the benefits of the printed paper as a digital replica.
Subscribe