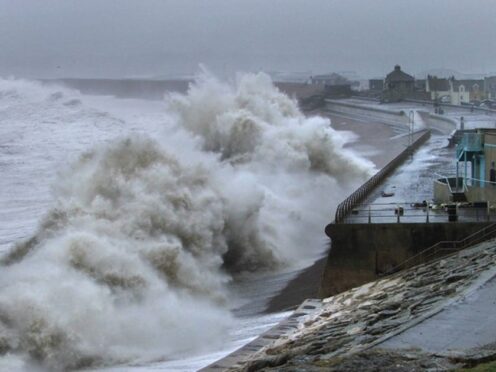
Scientists have analysed record storm surges across the British Isles to help predict future coastal flooding as climate change causes more frequent and extreme weather events.
Oceanographers at the University of Southampton conducted the most detailed spatial analysis to date of storm surges along coastlines, examining data recorded between 1980 and 2017.
They defined a storm surge as an abnormal rise in seawater level during a storm, measured as above that of the normal tide height for the area.
It is caused by wind pushing water onshore and is influenced by a storm’s size, speed and where it tracks in relation to the coast.
Storm surges are “the most important driver of flooding in many coastal areas,” according to Ivan Haigh, a professor at the University of Southampton and co-author of the study.

He said: “If we can understand how the differing characteristics of storms affect surges in many different coastal locations, we can more accurately predict the impact they will have on those localities, how best to counter the effects, and how they may increase with climate change.
“Our research will help improve the accuracy of statistical models used to make these predictions.”
The team identified 270 extreme storm surge events over the four-decade period, based on qualities like their duration, severity and footprint size, which means the extent of simultaneous flooding along a stretch of coastline.
They found that coastlines in the north of the Irish Sea experience the longest and largest surges.
Meanwhile, those occurring around the south-west coast of England were found to have the smallest geographical footprint and last the shortest amount of time.
Across all coastlines, the winter seasons of 1989/90 and 2013/14 stood out with the highest number and most severe storm surge events, they said.
The most extreme of these was in the winter of 1989/90 – caused by a storm on February 26 1990, which affected sea levels along the north, east and west coasts.
Remembered for extreme flooding in the towns of Towyn and Clwyd in Wales, the event forced five thousand people to be evacuated from their homes and businesses.
Meanwhile, the stormiest season in the study period was the winter of 2013/14, which contained the most frequent severe flooding events with 13 flooding episodes, compared with five in 1989/90.
This included the storm surge of December 5 2013, which saw some 36 flood warnings in East Anglia and resulted in the loss of properties along the coasts of Norfolk, Suffolk and Essex.

Dr Paula Camus of the University of Southampton and Universidad de Cantabria (Spain), and lead author of the study, said: “It is crucial we learn lessons from past storm surges in order to help inform our response to future coastal flood risk.
“Changes to our climate will likely mean more frequent and extreme events, so having accurate data on which to base decisions about infrastructure and emergency response is crucial.
“We hope our study can better inform the assessment of risk and impacts.”
The researchers said they acknowledge that their study does not take into account astronomical influence on the height of tides, but added that this can be incorporated in the future.
The study, published in the June edition of the Weather and Climate Extremes journal, also involved scientists in Spain, the USA and The Netherlands.
Enjoy the convenience of having The Sunday Post delivered as a digital ePaper straight to your smartphone, tablet or computer.
Subscribe for only £5.49 a month and enjoy all the benefits of the printed paper as a digital replica.
Subscribe